How Grafanalib Helps You Manage Dashboards at Scale
For enterprise organisations, data is everything, but when they have to manually configure and transfer dashboards between environments, data soon becomes a chore.
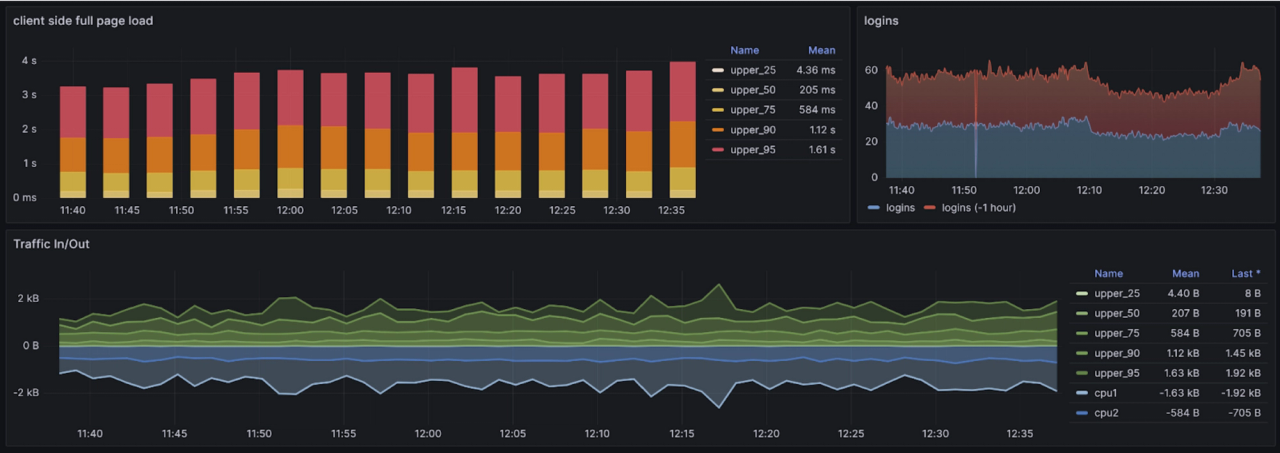
Whether for business metrics, observability or other useful information, dashboards displayed on dedicated screens at home or in the office have become the way to consume realtime, actionable data. But what happens when you reach the point where you’re trying to deploy hundreds or even thousands of dashboards—many of which show parts of the same data in different ways—across your organisation?
Contino supported a large enterprise customer in the UK to map their data flow from artefact creation through to public release—an engagement that required us to deliver a stable, secure, auditable and, most importantly, manageable approach to deploying dashboards at scale.
As part of this work, we chose Grafana Cloud as our observability platform and, after assessing other solutions, we determined that Grafanalib was the ideal solution to help manage both components and dashboards entirely from code.
In this blog, we’ll take you through our work moving from manual configuration to automated deployments and we’ll explore how organisations can unlock value by scaling dashboard creation and management to a point where teams can self-serve.
Why Dashboards Matter
Dashboards are a key part of monitoring your digital estate; they help you keep an eye on your cloud spend, measure virtual machine resource usage, monitor your API error rates, and everything in between. One of the most adopted tools for creating and consuming dashboards is Grafana, an open-source visualisation tool from Grafana Labs. A powerful and extensible bit of software that can plug into a wide variety of data sources, it allows you, your team, your enterprise, or even total strangers to inspect and analyse those data sources through queries and visualisations in the graphical user interface (GUI). These queries and visualisations can be saved to form a dashboard, which can then be shared and published at a specific URL.
Dashboard Design
Once you know how to create a dashboard, the next step is considering what to create.
Dashboard design can be a very subjective topic, although Grafana’s best practices give an idea of what good looks like. It’s clear that there is one underlying theme that seems to be agreed upon and that’s that every dashboard should answer a question you ask regularly. This means your dashboard shouldn’t include any irrelevant information. If you stick to this ethos, you’ll ensure your dashboards are both efficient and easy-to-understand—a large amount of information is overwhelming and will impede a user’s ability to find a specific answer to a specific question.
It’s likely your organisation has several questions you want to answer regularly, such as:
- Is our API performing as expected?
- Are we tracking to stay within our cloud spend limit this month?
- How is our release cadence compared to the previous quarter?
The more questions you have the more dashboards you’ll need to create, so with a bit more clicking around the Grafana GUI, you’ll have created a couple of dashboards that answer the specific questions you and your team are asking. Perfect, life is good.
Dashboard as Configuration
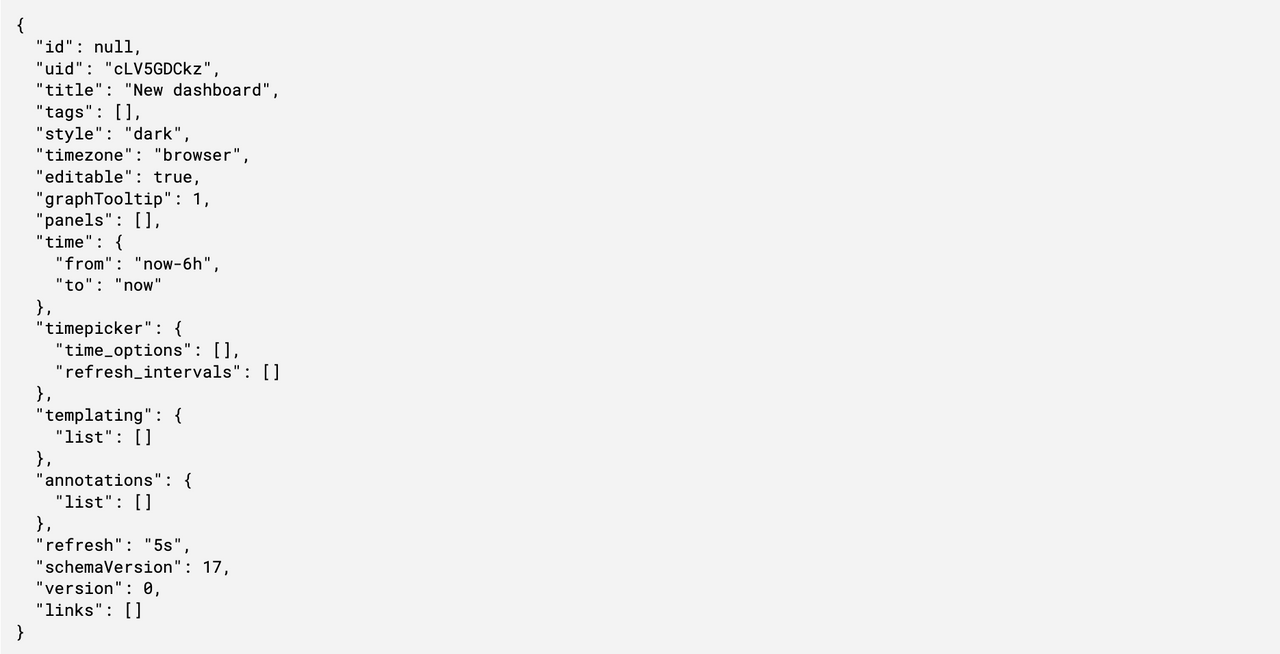
One day an engineer thinks up a simpler query to extract your API response codes into a chart, and modifies a visualisation, only it’s quickly realised this isn’t aggregating the data as expected. How do you revert back? What even was the original query? You quickly tie yourself in knots and aren’t sure where you started or how to get back. This problem is caused by creating and managing dashboards through drag-and-drop in the Grafana GUI. While this works well for developing and hacking around, you would always check your source code into version control and likely leverage branching and pull requests for development for these exact reasons. Under the hood Grafana dashboards are just JSON objects and JSON is just configuration. So can we store these in version control to provide change history and ability to roll back? Absolutely.
CI and CD
Terraform is a tool for automating infrastructure and provisioning, but thanks to its extensible provider design can be used to declaratively define lots of different systems. Grafana Labs maintains a Grafana provider to Terraform, which will allow you to provision dashboards into your Grafana instance, from JSON objects. So now you can modify your dashboards in the Grafana UI, and once happy export the JSON objects and check your dashboards into version control, review changes via pull requests, rollback unwanted changes, view an audit trail of history, and automatically deploy changes to the dashboards to your Grafana instance. Life is back to being good.
Scaling
If you’re operating as an individual, this may be the finish line for you. But if you’ve gotten to this point and are working as part of a larger team, it’s likely you’ve had more than one change to a dashboard waiting to happen at the same time. You will now encounter another problem, the JSON objects generated by Grafana are not very developer friendly. They’re difficult to compare changes, quite verbose, and changes will invariably conflict with each other leading to extremely time consuming conflict resolution as version control deals with changes line by line. So where from here? We need an easier and more developer friendly way to write dashboards.
Grafanalib is a tool maintained by Weaveworks, which allows Grafana dashboards to be written in Python. Writing Python is much more developer friendly than writing JSON configuration, changes are much easier to resolve and often don’t conflict at all. Adding a new panel is now as simple as a couple of lines of very readable Python code. Being code and not configuration means it now be linted, formatted, and even tested. It integrates better into IDEs and is much less error prone. Grafanalib can then spit out the dashboard JSON objects from Python, and these can be saved as files. Grafanalib can also be used to deploy dashboards directly to Grafana, but we prefer to stick to Terraform to maintain the benefits of plan/apply that Terraform offers as well as integration with the rest of our infrastructure codebase.
Consistency
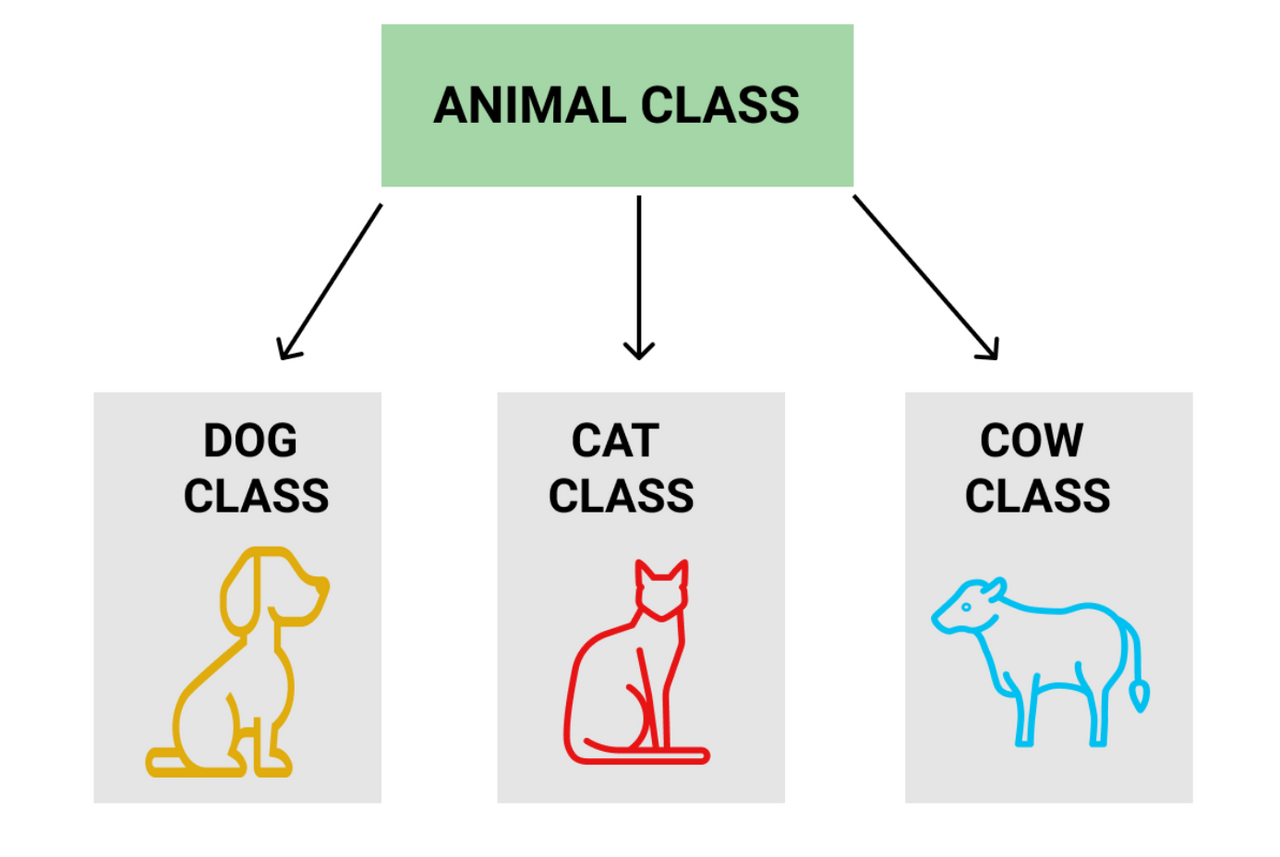
So now you have enabled efficient development of your dashboards, your developers can all make changes to the dashboards quickly and easily, and everyone understands the code. But your dashboards aren’t consistent. Inconsistent dashboards means consumers have to learn how to use each dashboard as they come to it, increasing the mental load of using the system as a whole and slowing down answering the questions the dashboards are answering. The solution? Now our dashboards are code and not configuration, we can employ programming paradigms such as Object Oriented Programming. This offers us the concept of classes and inheritance. By developing parent classes for a dashboard, a panel, and even specific panels like Stats or Timelines, which can be consumed by developers, every dashboard and panel created can have a consistent look, feel, and behaviour. In addition this will further reduce the lines of code required meaning dashboard development is even quicker and simpler.
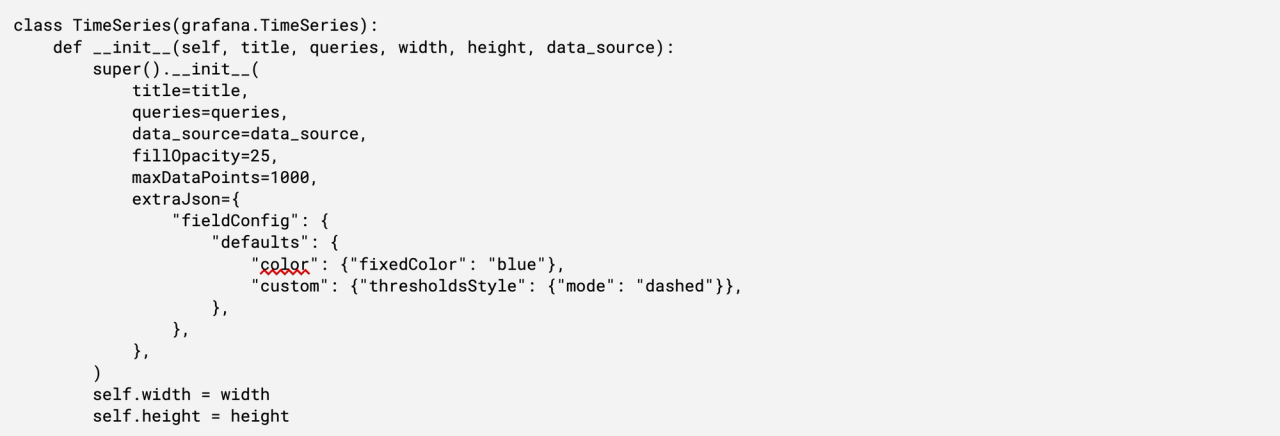
This inheritance provides some guard rails and lowers the barrier to entry for developers to make changes and create dashboards. These classes can also be separated into an external library to enable consumption by multiple teams to help enable consistent and fast dashboard development across the entire organisation. You can use these classes to set organisation defaults such as colour, thresholds, datapoints, and tooltips.
By setting defaults in the class like this, all dashboards created by any developer in any team will have a consistent look and feel, allowing anyone to consume a dashboard quickly and easily.
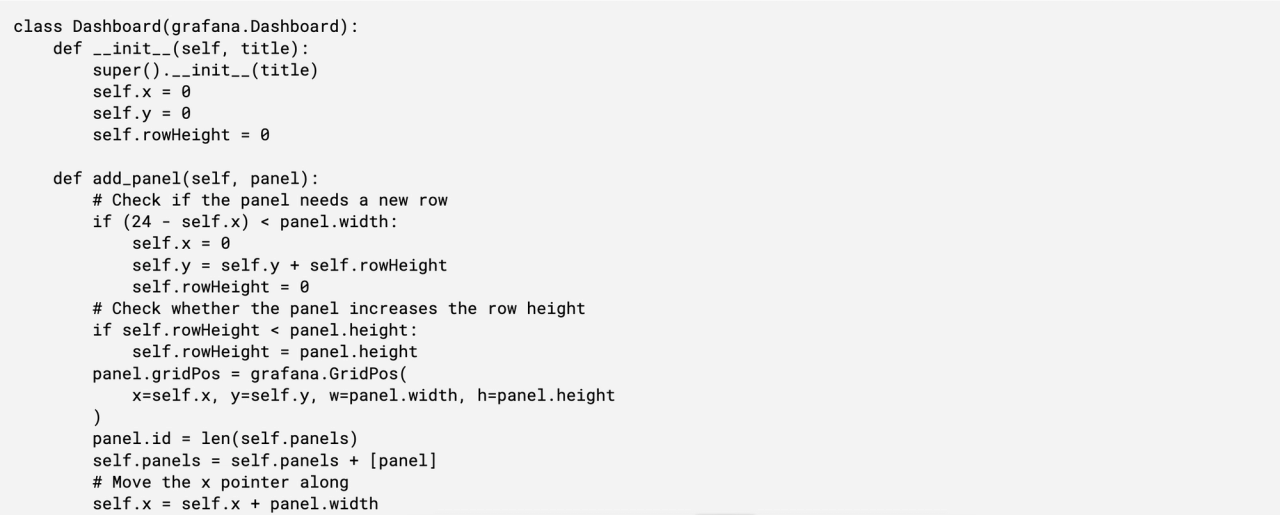
One complexity when using Grafanalib is that it requires you to manually place panels in a dashboard as well as give them an ID, which can lead to some manual effort to work out start and finish x and y coordinates. A solution is to write some helper methods for your dashboard class to enable you to quickly and easily add panels.
This will attempt to fit a panel onto the existing row where possible, and handle the coordinate setting and ID generating for you.
To enable the best practice of deploying the same code to all your environments, you will likely need to change the data source name because this is often specific to the Grafana instance you are deploying to. One solution is to read the data source parameter from an environment variable. At build time this can be set to the matching data source name in your Grafana environment.
The final piece of the puzzle is to write the dashboard to disk, so that Terraform can read and deploy it. Grafanalib provides a way to output the dashboard JSON, and we can use that to extend our dashboard class with a __str__ method.
Now generating the file is as simple as using Python to write it to disk.
And using Terraform to deploy all your generated dashboards.
Summary
There are still advancements to be made such as having an automated way to generate a visualisation of the dashboard, which would much improve the developer experience of reviewing changes. However this approach has worked very effectively for us on projects with dozens of dashboards that are constantly being developed in parallel. Being able to track change history in Git provides audit and rollback capability, deploying through Terraform provides CICD, the ability to deploy to multiple environments easily, and reduces manual changes.
Finally being able to develop dashboards in code rather than configuration allows developers to leverage tooling and programming paradigms to scale out dashboard management across an organisation in a controlled way.
To find out more about how to improve observability and monitoring at your organisation, reach out to a member of the team.
