Ultimate Guide to Observability: What It Is and How to Do It Well
The complexity of software systems is ever increasing; organisations need to invest in ensuring that their systems are operable.
In this blog, we’re taking a deep dive into observability: what it is, why you should be building monitoring into everything you do, what we mean by ‘the observability river’, and the five questions to ask yourself in order to get started.
What Is Observability?
An observable system is one where you can infer its internal state purely from the system's outputs—and one that is operable at the speed demanded by modern digital transformations.
Observability is the logical next step from traditional monitoring practices, and a core tenet of the Site Reliability Engineering (SRE) movement.
When we talk about observability, we mean taking an approach to monitoring where the platform or product being monitored is a “black box”—and the only way to understand what it is doing inside is to observe the outputs.
Monitoring Vs Observability
While monitoring has previously focused on API and website response times—or system metrics such as CPU, RAM, and disk space—observability takes a more holistic approach to system health and often includes user experience and business processes, in addition to more traditional monitoring measurements.
As the world moves towards an SRE approach to systems development and deployment, it is vital that we start moving away from asking if a service is “up or down” and towards proving that service is providing value to our customers, the business, and our engineering teams.
At Contino, we expand observability outside the cloud environment or data centre and into your business by monitoring not just your application and platform, but also how your business, developer teams and even revenue streams are performing—to give you a complete picture of your organisation from feature request through to customer satisfaction.
Why You Should Build Monitoring into Everything You Do
Often in engineering, we focus our development stories on the user interaction. Stories such as “As a user, I want to be able to add an item to my basket, so I can buy it” are not uncommon, but what about the internal requirements for our team and those around us within our own organisation that fall outside the “end-user” customer?
Let’s take a look at what the change would be within your organisation’s approach to monitoring if you started to add in the following stories...
User Stories From Across the Business
1. The Developer
I want to see how my application is performing, so I can refactor the appropriate parts of the codebase to improve user experience.
This is a story about a process we’re all familiar with—we check the data, then we refactor and see if the data improves—however, when was the last time you wrote it down as a user story on the backlog?
2. The Product Owner
I want to know how my application is performing, so I can prioritise the backlog more effectively.
Application performance can help product owners, tech-leads, scrum facilitators, and agile coaches move stories around the backlog to prioritise performance enhancements alongside new features.
3. A Marketing Designer
I want to understand page load times, so I can ensure our content is optimised appropriately.
Both image optimisation and compression of assets are known to be reasons for long page load times and, with access to the monitoring dashboards, your marketing teams can look at the way they generate media for the site and find the levels of compression/quality loss that are acceptable.
4. A Sales Executive
I want to ensure the website is serving the correct content, so my targeted mailings don’t go unanswered.
The sales team is about to send out a sales email to 2,000 existing customers inviting them to sign up for a new service based on their current preferences. The email has a link in it to an asset on the website, and they’re going to track how many customers click that link as well as who they are using a marketing automation tool.
But what if the downloadable asset suddenly disappears for an unexpected reason halfway through sending the email to the database?
Providing the sales team with observability and insight on their assets or similar suddenly allows them to halt sending out the mailshot, follow up directly with those who clicked the link but didn’t get the asset, or even look at whether people preferred a particular format of the document to another.
So how can teams get started on their observability journey? What tools do they need? What do they need to do with their data?
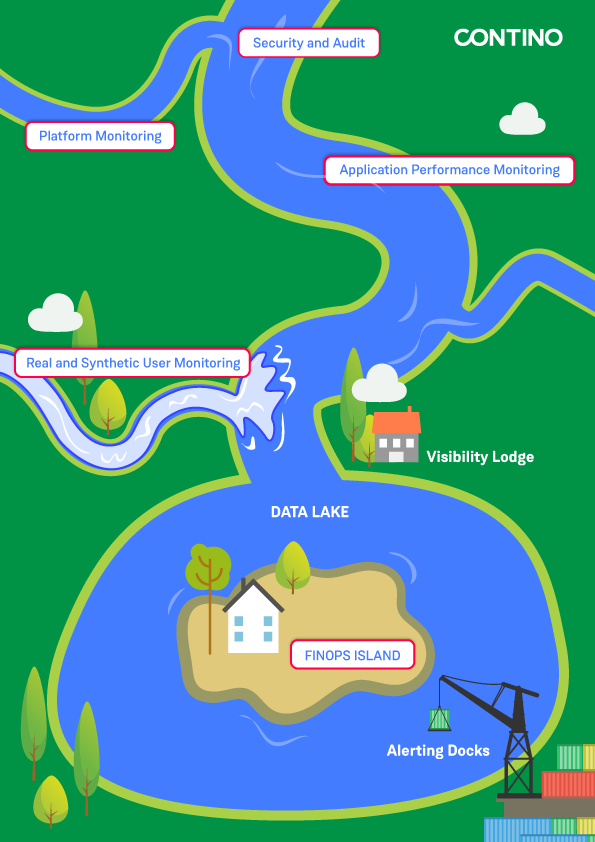
7 Steps to Observability: Introducing the ‘Observability River’
The Observability River is a tool that we use at Contino to help our customers understand:
- the types of data that you can collect and alert on
- and the way in which the data can start off from a simple stream, and keep building, until you have a lake of information to rely on for your observability solution.
We’ve written about it in greater detail on our engineering blog, however the key points of the process are:
1. Start with security monitoring
Access and audit logs, number of failed logins, inbound traffic that could be a bad actor; these are all vital things to know about your platform
2. Add in platform metrics and logs
These could be syslog events and metrics about CPU, RAM, and Storage, or Cloud Platform Metrics about how quickly Lambda functions or similar are performing
3. Now that we have a solid base to build on, let’s add in our Application Performance Monitoring
This includes things like how quickly a class or function is executed, database lookup timings, and can even include trace data based on OpenTelemetry or similar
4. We’re nearly at the point where we can start to make sense of this data, but let’s collect two more important pieces of information
What your users are doing, and what you thought your users would do. Real User Monitoring (RUM) and Synthetic User Monitoring (SUM) allow us to see both the “happy paths” and the actual usage of your product and compare the experience that is returned to the user
5. Now we have all this data in our “Data Lake”, what do we do with it?
We visualise it of course! Providing a graphical interpretation of the data is what turns it into information and makes it useful. If you’re storing data in multiple locations and formats without anyone looking at it, then you may as well not collect it at all. Show your data the light of day; let people play with it!
6. If you have the expertise available (and Contino can provide this if you don’t!), then why not add in your financial operations (FinOps) data as well?
Imagine a dashboard that showed you not just customer satisfaction and application performance, but the costs of running the platform vs the amount of revenue it was generating. The possibilities are endless!
7. Finally, we get to Alerting
Your engineers need to know that if something goes wrong or looks like it will, they're going to be notified and when that happens they need the context and links to runbooks in order to react appropriately
If you need help with your journey down the “Observability River”, why not get in touch?
How to Pick the Right Observability Solution
There are a wealth of monitoring solutions available for engineers and developers to choose from, so how do you select which is most appropriate for you?
It’s frequently the case that neither the most expensive nor the cheapest monitoring solution is the answer when starting on your observability journey, so let’s take a look at the core decisions you need to make when selecting a monitoring solution for your project.
Question 1: Do you need a team that can support a monitoring solution?
Before we start worrying about whether we’re going to run a monitoring solution in-house, in the cloud, or if we’re going to purchase a managed service, we need to know if we have the knowledge and capability to run that service.
It’s all well and good deciding that it’s cheaper from a licensing perspective to run something like Prometheus.io because it’s “free”, but that doesn’t take into account the cost of training up your staff or hiring in new team members to run it for you.
Let’s assume you need a team of 5 people to design, run, support, and improve a Prometheus at scale (at least 1000 instances/servers/containers across used by multiple teams) for you on an average salary of £40,000/year, and that you need to spend an additional £250/person in training, along with internal charge-backs of around £2500/month for the infrastructure:
- Annual Salary: £40,000 * 5 = £200,000
- Annual Hosting: £2,500 * 12 = £30,000
- First Year Training Costs: £250 * 5 = £1,250
- Total First Year Costs: £231,250
- Ongoing Annual Costs: £230,000
That’s a lot of money to spend on a solution that you thought was “free”!
You may have people within your organisation who already know your monitoring solution of choice well enough to deploy it, and you may want to “hide” the cost of moving them to the new team because it’s a cost the company is already bearing—but it’s still not going to be “free” and you’ll still need a team to manage the solution.
Question 2: Are we happy to allow the monitoring data to exist outside our environment?
When running a monitoring solution, you generally have three options...
OPTION 1: “Behind the firewall”
Generally considered to be the “most secure” by many enterprise organisations—the theory is that by ensuring the data is kept within the environmental boundaries, there is less risk of monitoring data (and therefore details of your infrastructure layout) leaking into the public domain.
OPTION 2: Software as a Service (SaaS)
This is rapidly becoming the primary way for organisations to purchase monitoring solutions, especially in cloud environments. It reduces the need for a dedicated team within your organisation and passes the difficulties of maintaining alerting platforms etc. on to a third party.
The downside is that your data goes into a dedicated “bucket” on a platform that is shared with multiple other companies, so if your monitoring provider gets hacked then the attackers will gain information about the state of your infrastructure.
OPTION 3: Cloud Monitoring
Cloud monitoring can fall between the SaaS and “Behind the Firewall” offerings as quite frequently cloud providers such as Amazon and Google will provide both fully-managed monitoring platforms (such as CloudWatch), and the ability to build your own from a managed service (AWS Managed Grafana coupled with AWS OpenSearch Service for instance).
Whilst this might be seen as a solution with all the pitfalls of both of the others, if managed correctly, this can provide a semi-hosted solution at a lower cost than a full SaaS offering in some cases.
Whether you choose 1, 2, or 3 from the above list, you’re going to need to think about your data storage needs before making the decision, especially as many SaaS providers will only host your data in certain geographical locations.
The Data-Driven Transformation of Insurance: 7 Data, AI and ML Use Cases That Differentiate Your Business
Insurance companies are feeling the pressure—from new FCA regulations, insurtechs or their own customers.
The biggest source of untapped competitive advantage is data.
We look at how the insurance industry can drive data-led innovation with machine learning and artificial intelligence.
Question 3: What do we want to monitor?
Choosing what to monitor and how you are going to monitor it is a massive part of deciding which tool to use.
Some tools are better at particular jobs than others — for example, I wouldn’t recommend using InfluxDB for log storage and querying, but on the other hand, OpenSearch is still relatively new to dealing with time-series metrics.
If we go back and look at the Monitoring River, we can see that there are five key areas that we can address when monitoring. Whilst combining the five into a single platform is absolutely possible, we need to ask “is it necessary?”
It may be that the platform you’re running hands-off security and audit logging to another team, you might not do FinOps yet, or you could be providing virtual instances to your customers and therefore not be overly concerned about Application Performance.
The reason I bring this up is that I’ve seen many organisations go for the most expensive/feature-rich/darling-of-the-moment monitoring platform that provides everything anyone could ever need, only to find out they didn’t need half of those features and are now lumbered with a hefty monthly charge.
Question 4: Which languages are we writing our applications in?
You need to be aware that some of the tools are better suited to particular languages than others.
As an example, AppDynamics is very popular amongst enterprise organisations for Application Performance Monitoring, and if you’re working with a Java or C# monolith then it’s probably fine. But as soon as you move into other languages such as Python or Rust, you’re going to want to look for something else because the support for those languages is really poor.
It used to be that AppDynamics was the only option if you wanted to visualise your application request flow however, these days pretty much every monitoring system out there can do the same thing including many of the Open Source ones, so there really is very little reason to stick with AppDynamics unless you’re bound by a license agreement or your team know AppD better than anything else (see Question 1!).
Newer offerings such as Datadog, NewRelic, or even Grafana coupled with an OpenTelemetry backend such as Tempo are all excellent offerings for application performance monitoring if you’re using more modern languages.
Question 5: OK, so what do I choose then?
This is a question that only your organisation can really answer because, as we’ve seen, it depends heavily on your environment and setup.
Having said that, my personal preference at the moment is to use SaaS where I can (Prometheus, Grafana, Loki, and Tempo if I can’t!), and having worked with the majority of the offerings out there I’d probably recommend Datadog.
Datadog isn’t the cheapest, but it’s not the most expensive either, and if you go past 500 hosts/instances then you qualify for a “bulk purchase discount”.
It has a “pay as you go” model that easily translates to licensing for cloud; it can do instance/host-level monitoring, log analysis, application performance monitoring, network monitoring, and many, many more things that you may never need; and it’s as simple as installing the agent, deploying the configuration file and watching your data roll into the pre-packaged dashboards.
In Summary
Choosing a monitoring solution has never been easy, and the plethora of products hitting the market at the moment as everyone tries to jump on the SRE/Observability bandwagon makes it difficult to pick the outliers and anomalies from the providers that actually work for you however, the above questions should set you well on your way.
If you need a bit more help with your observability, then get in touch with the folk at Contino who will be only too happy to support you on your journey down the monitoring river!
We work with regulated enterprises on bringing observability into the heart of their operating model. From on the ground engineering to shaping your future digital strategy, we have a proven track record of producing results.
Find out more about how we partner with AWS to bring open-source observability to our customers.


