How the Right Tools Can Help Businesses Unlock Their Sustainability Goals
In our latest ebook Sustainability in the Cloud: How to Leverage AWS to Grow into a Greener Business, we explore how AWS is enabling sustainability of the cloud, and the vital first steps enterprises can take to be more sustainable in the cloud. Crucial to this is not only having the right tools, but having the necessary data and being able to interpret it correctly. Many enterprises, however, are relying on cost optimisation tools that don’t always tell the full story about their carbon footprint. To address this, Contino has developed an open-source sustainability metrics dashboard that enhances sustainability insights, making it easier for enterprises to take action.
In this blog, written in collaboration with Lauren Tate, we explain how the new Sustainability Metrics Dashboard can help businesses make better decisions when it comes to carbon footprint reduction.
Measuring Cloud Impact
Growing numbers of organisations are incorporating environmental sustainability into their corporate strategies. In fact, as part of the UK government’s Build Back Greener net zero strategy, many large businesses in the UK are now required by law to report on their greenhouse gas (GHG) emissions.
Data centres and data transmission networks are responsible for nearly 1% of energy-related GHG emissions. By 2026, Gartner predicts public cloud spending will exceed 45% of all enterprise IT spending, up from less than 17% in 2021. This means the global cloud carbon footprint will continue to rise, and businesses should factor it into their sustainability strategies.
It’s More Complex Than Cost
When it comes to reducing energy and carbon footprint, organisations are relying on cost optimisation tools to make carbon reduction decisions, but these can be misleading without specialist knowledge—actions that reduce cost may in fact have little impact on, or perhaps even increase, carbon footprint.
Using cost as a proxy could:
- Use time inefficiently: cause time to be spent on actions that don’t reduce footprint
- Unwittingly increase carbon footprint: when decisions are taken where the cost proxy doesn’t have direct correlation with carbon emissions
In 2021, the three largest public cloud service providers (CSPs) released tools to help their customers understand their carbon footprints and reduce their emissions. At the time of writing, these tools are developing and are difficult to gain actionable insights from. For example, currently, AWS carbon footprint data is provided on a three-month delay for “EC2, S3, and other” while GCP doesn’t provide carbon footprint data on all products. None of the CSPs offer insights on resource-level granularity.
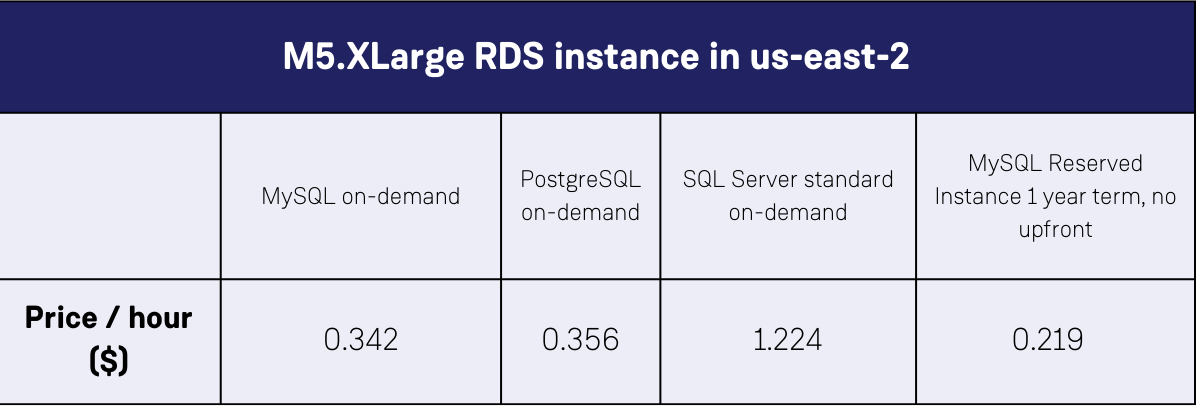
The alternative for decision makers is therefore to rely on cost optimisation tools from either CSPs themselves or third-parties, but there is a misleading assumption that there’s a direct causal relationship between cost and carbon footprint. For example, CSPs don’t charge for ingress network traffic, despite it having a potentially significant energy cost. Similarly, if an AWS customer has identical compute, storage and networking usage of the following databases across the same time time and underlying data centre, the assumption would be that the carbon footprint should be in the same order of magnitude (at least across CSP scope 1 and scope 2 emissions), whereas the cost is substantially different, as illustrated on the following matrix:
Introducing Contino’s Sustainability Metrics Dashboard
Contino's open-source initiative aims to capture demands from cloud customers as well as domain expertise from sustainability specialists in order to build the Sustainability Metrics Dashboard roadmap.
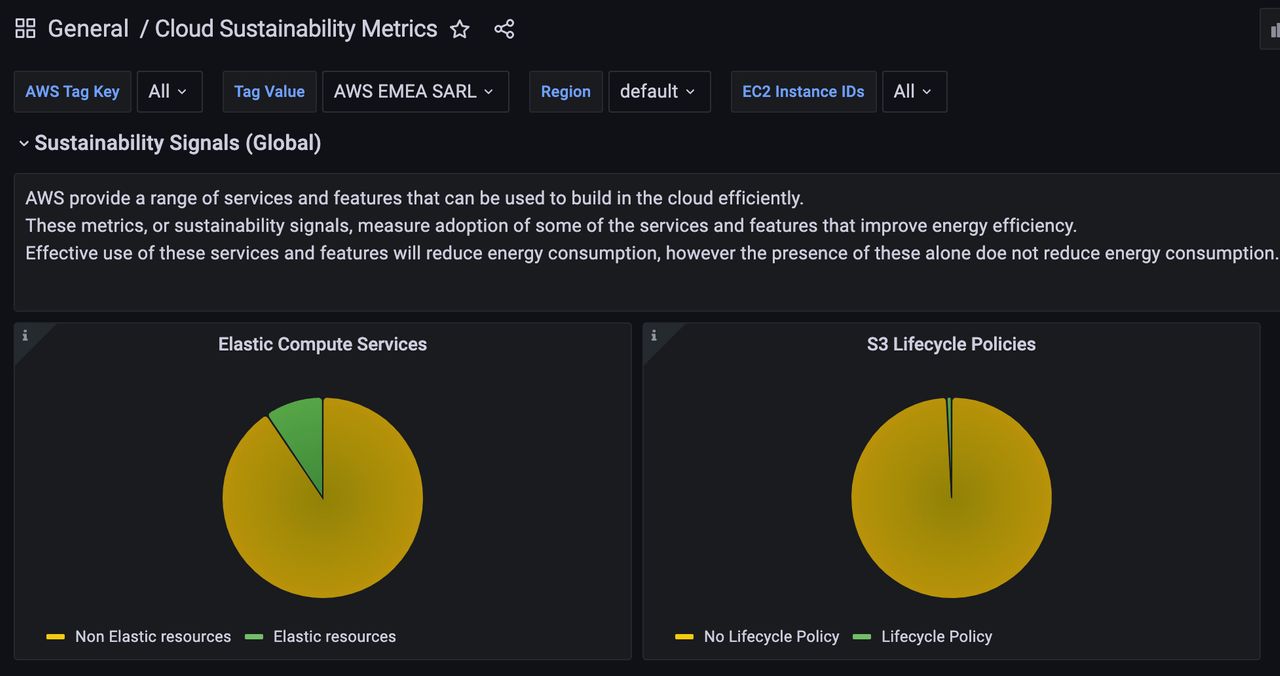
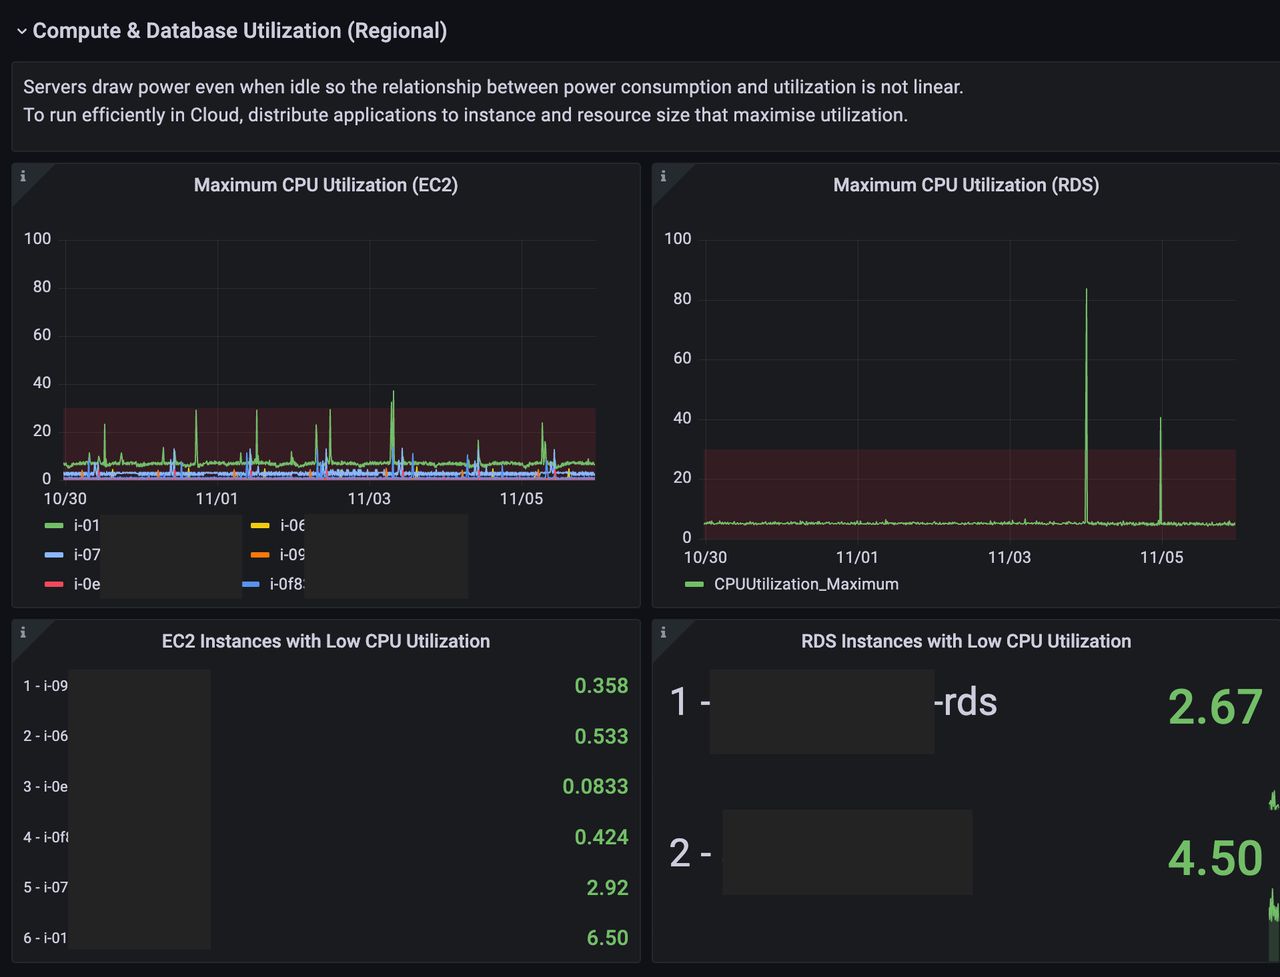
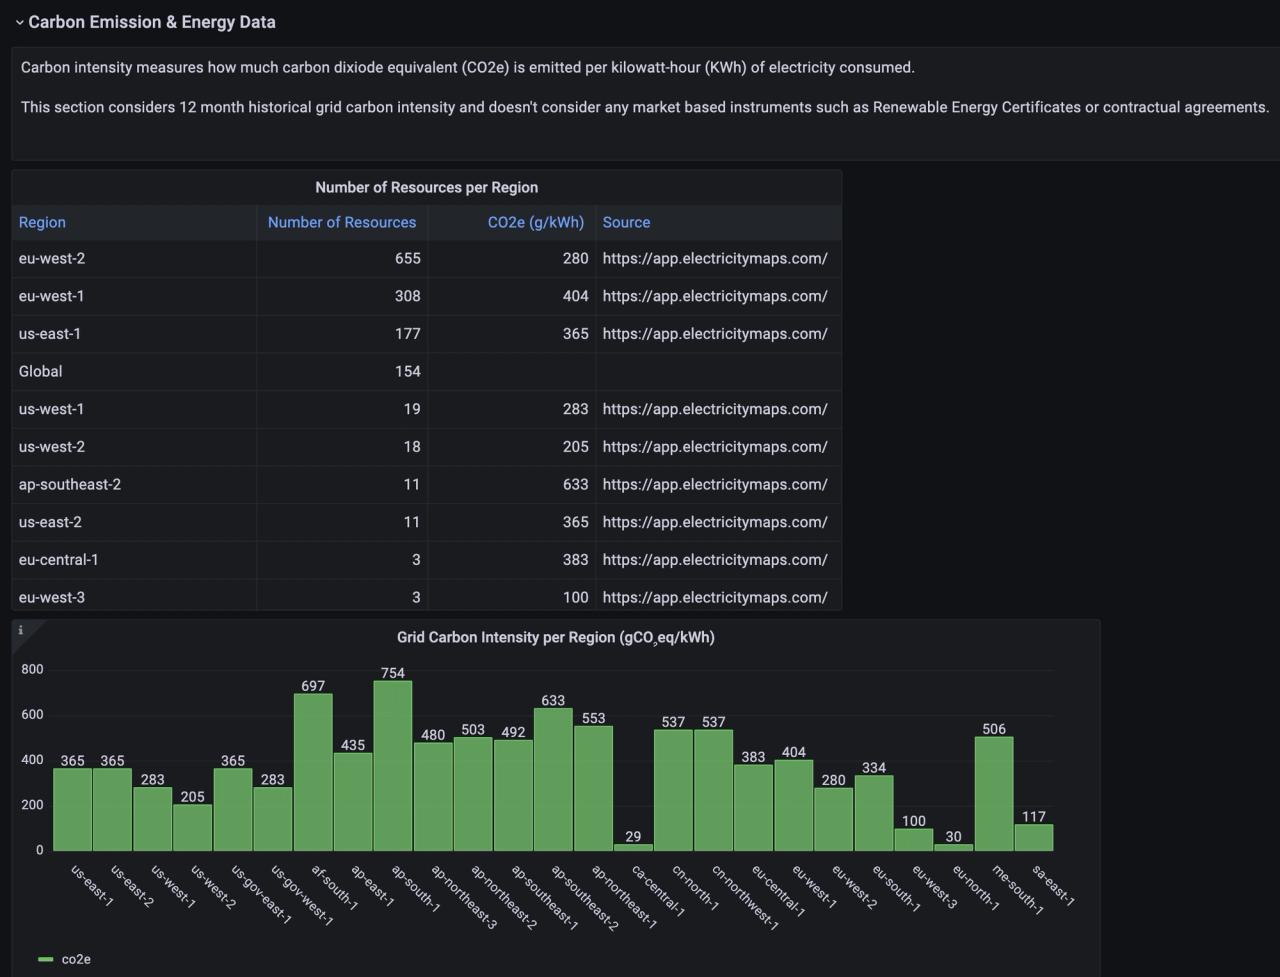
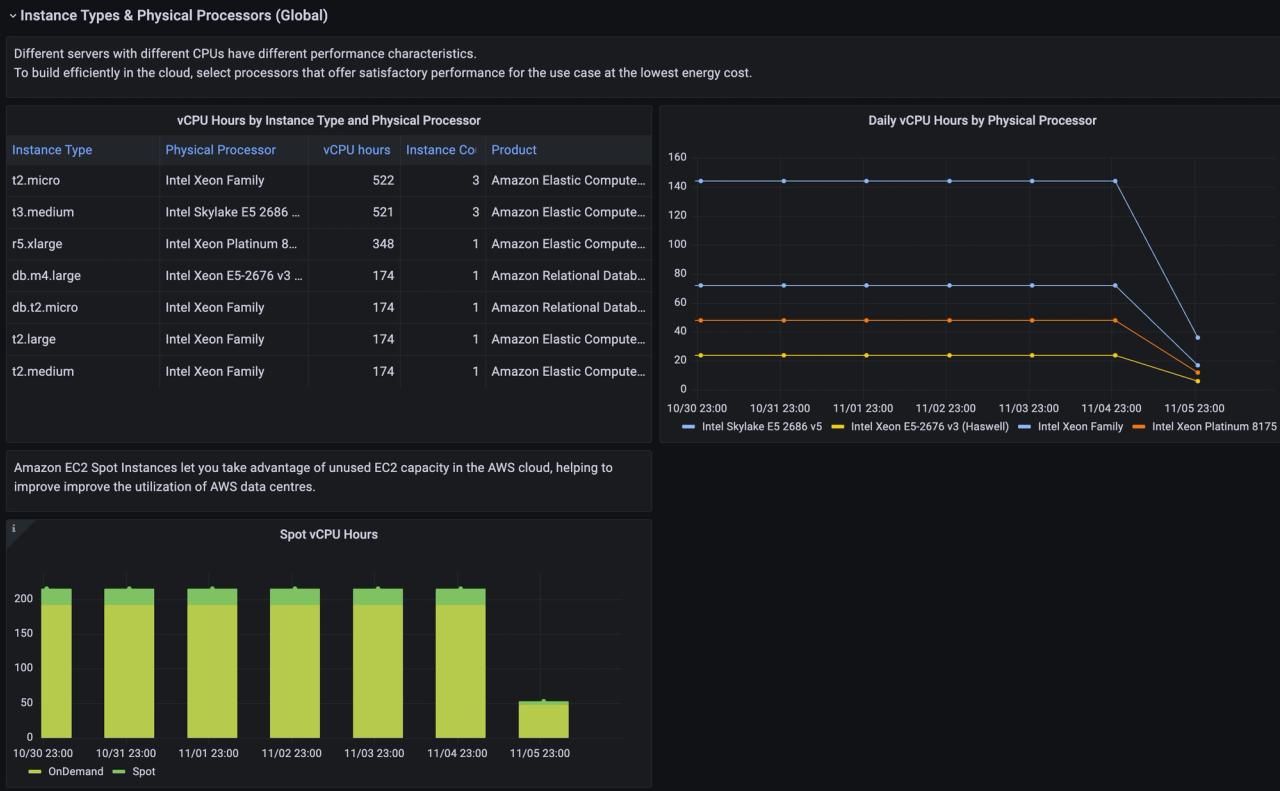
The Sustainability Metrics Dashboard provides visibility into key metrics for building sustainably in the cloud. It shows resource-level data of compute, network, storage and operational usage to support customers on their journey to reduce their carbon footprint. The dashboard doesn’t currently provide data on carbon emissions or energy usage, but instead provides actionable resource-level data, such as average utilisation, to help customers make informed decisions.
The idea behind building the Sustainability Metrics Dashboard as an open source initiative, is to join forces with the community to develop and extend the methodology, data sources and solution with transparency. We launched the initiative with the minimum viable product at the start of 2023 and it currently supports AWS only and collects metrics from AWS Cost and Usage Report, AWS API scraping scheduled serverless jobs and static reference data about carbon emissions.
Our sustainability dashboard isn’t the same as the cost optimisation ones. In the cloud, cost and energy consumption will both vary with usage and while many cost optimisation actions will reduce usage and therefore consumption and emissions, not all will. Cost can be a misleading metric for environmental sustainability as service usage isn’t always linearly correlated with energy usage. Usage isn’t the only consideration in cloud pricing and cloud costs will be impacted by other factors such as rate optimisation i.e. reserved instances that have no direct impact on emissions. As such businesses might mistakenly deduce that they’re reducing their carbon footprint in line with their costs, when this isn’t necessarily the case.
We’re really proud of this first step and intend to grow the initiative based on feedback from our clients and the community. We’re sharing the code base in our GitHub repository and look forward to starting conversations that will develop it further. Please reach out if you’d like to contribute!
Read Sustainability in the Cloud: How to Leverage AWS to Grow into a Greener Business to learn more about how Contino can help businesses take their first steps towards sustainability in the cloud.
